
Last updated: 27 October 2026
The short answer
Universities measure computer-lab usage by installing a lightweight agent on every lab PC that records logins, sessions, applications launched and machine status. The data is turned into lab utilisation, peak hours and peak concurrent users per licensed app. Comparing that peak with the seats you pay for shows exactly where to cut licences before renewal.
- Measure concurrent use, not installs or logins. It is the number your licences are sized on.
- Track utilisation and peak hours per lab, so you know which rooms are full and which sit idle.
- Compare installed vs licensed software to catch over-deployment and seats nobody uses.
- Review the data before each renewal, and send deans and finance the same evidence on a schedule.
Why install counts and login records are not enough
Most university IT teams already have some usage data: a software deployment tool that knows where an application is installed, Active Directory logins, perhaps a booking system for teaching labs. None of these answers the two questions that drive cost: how busy are our labs really, and how many people use each licensed application at the same time?
An install count tells you that SPSS or Adobe Creative Cloud is available on 400 machines. It says nothing about whether ten or two hundred students open it in the busiest hour of the semester. A login record tells you a PC was used, not what it was used for. Without application-level, time-stamped data, renewals are sized on last year’s quantity plus a safety margin, and lab expansion is justified by how full the rooms feel.
The five metrics that matter
These are the measures that turn lab data into decisions. Each one maps to a question finance, a dean or the IT director will ask.
| Metric | What it measures | Decision it supports |
|---|---|---|
| Lab utilisation | Share of open hours each lab PC is in use, per lab and per week | Which labs to consolidate, repurpose or extend |
| Peak hours (heatmap) | Use by day of week and hour of day | Timetabling, opening hours, where to add capacity |
| Peak concurrent users per app | Highest number of people using an application at the same moment | How many concurrent licence seats to renew |
| Simultaneous instances | Highest number of copies of an app running at once | Server and capacity planning for VDI or app streaming |
| Installed vs licensed | Software deployed beyond what was paid for, or paid for and never installed | Audit exposure and licences to drop |
Two of these are easy to confuse. Concurrent users is a compliance number: it is what a concurrent licence must cover. Simultaneous instances is an operations number: one user can run several copies, which matters for server sizing. Good lab analytics reports both, separately.
How to measure computer-lab usage, step by step
- Deploy a lightweight agent to every lab PC. It should record applications launched and run time, logins and sessions, hardware and installed software, and machine status (online, in use, offline). Roll out one lab first, then the rest.
- Connect it to Active Directory. Reports then show real users, departments and groups instead of machine IDs, so you can report by faculty or programme.
- Tell the system how each application is licensed. Concurrent, per-device and site licences are counted differently, so the same usage data can mean a shortage for one app and a surplus for another.
- Collect a full teaching period. Include the busiest weeks and exam periods. Averages hide peaks, and peaks are what licences and lab capacity must be sized for.
- Report on a schedule. Send a monthly lab and licence report to IT, deans and procurement, and a renewal review 90 days before each contract ends.
What the data typically shows
Example from a Malaysian university deployment (anonymised)
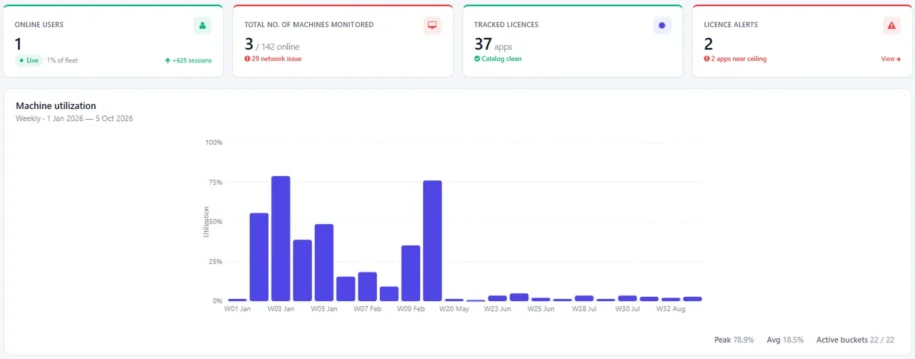
Eight months of vDash data across 15 PC labs showed:
| Finding | Result | Action taken or recommended |
|---|---|---|
| Average lab utilisation | 39.6%, with a single lab reaching 100% at its peak | Plan capacity from peaks per lab, not the campus average |
| SPSS peak concurrent use | 13 of 200 licensed seats (about 91% unused) | Right-size SPSS to around 30 to 40 seats |
| Adobe Creative Cloud | About 97% of licences unused | Cut the plan to match measured demand |
| SPSS sessions on VDI | 34% of sessions (568 of 1,661) already ran on the VDI server | Count VDI use before buying more lab seats |
| Idle labs | 4 labs unused for three months or more | Consolidate or repurpose |
| Reporting effort | Reports in seconds instead of about three days of manual work | Schedule reports to management |
None of these findings needs new hardware to act on. The opportunity comes from seeing actual demand and renewing to match it. The pattern is worth checking in any lab estate: average utilisation is far below what busy rooms suggest, a handful of applications drive most of the peak, and a few expensive titles are licensed for far more seats than anyone uses at once.
Turning usage data into lower licence costs
- Right-size concurrent licences at renewal. Renew to the measured peak plus a sensible buffer, not last year’s quantity.
- Drop what is never installed or never opened. An installed-vs-licensed report lists both in one view.
- Consolidate idle labs. Move timetabled classes from low-use rooms and free the space and machines for other uses.
- Count virtual use. If students already run an application on VDI or app streaming, fewer physical lab seats are needed.
- Never miss a renewal. Expiry reminders for licences, warranties and support contracts give procurement time to act on the data.
Where vDash fits
vDash is CloudDesk’s AI-enabled lab, licence and asset analytics dashboard for university IT teams. A lightweight Windows agent on each PC feeds a live dashboard that shows every machine as online, in use or offline, refreshed every five seconds. vDash calculates utilisation and peak concurrent use, tracks licence usage across five licence models and flags shortages automatically.
IT teams use usage heatmaps by day and hour, live tiles per faculty or lab group, per-user profiles from Active Directory, an installed-vs-licensed report, machine inventory with warranty and support dates, and expiry reminders. Scheduled PDF and PowerPoint reports go to IT, deans and procurement by email, and multi-campus institutions get one console with full separation. vDash is built and supported in Malaysia.
vDash also shows how much use already runs on virtual desktops. That is the first question to answer before choosing vDesk or CloudDesk VDI to deliver lab applications.
Frequently asked questions
What is computer-lab utilisation and how is it calculated?
Lab utilisation is the share of available PC time that is actually in use. Most IT teams calculate it as the hours machines are in use divided by the hours the lab is open, per lab and per week. A dashboard such as vDash calculates it automatically from agent data and shows it alongside peak use, so you can compare an average week with the busiest hour.
Why measure peak concurrent use instead of installs?
Installs only show where software could run. Peak concurrent use shows the highest number of people using an application at the same moment, which is the number a concurrent licence has to cover. If 200 seats are licensed but the peak never goes above a few dozen, the gap is the saving available at renewal.
How long should we measure before a licence renewal?
Measure a full teaching period if you can, including the busiest weeks and exam periods, so the peak you size to is a real peak. Start well before the renewal date: the example in this article used eight months of data across 15 labs.
What does vDash collect from each lab PC?
The vDash agent records applications launched and their run time, user logins and sessions, hardware and installed software, and whether each machine is online, in use or offline. It syncs with Active Directory so reports show real names, departments and groups rather than raw IDs.
Can vDash show how much lab software use already happens on VDI?
Yes. vDash reports where sessions run, so you can see what share of an application's use happens on virtual desktops versus physical lab PCs. In one deployment, about a third of SPSS sessions already ran on VDI, which changes how many lab seats you need.
How quickly can we see data, and how is vDash priced?
Agents install in minutes and live data is available by the end of day one; a full lab can be covered in under a day. vDash is sold as a per-PC annual subscription, and you can try it first with a free 2-week pilot on your own labs.
Try vDash free for 2 weeks
See your own lab utilisation, peak hours and licence use before your next renewal. Agents install in minutes and live data is ready by the end of day one. vDash is a per-PC annual subscription, and the pilot is free for 2 weeks.