
vDash: AI-enabled lab, licence and asset analytics

AI-enabled analytics that turns lab, licence and asset usage into decisions you can act on.

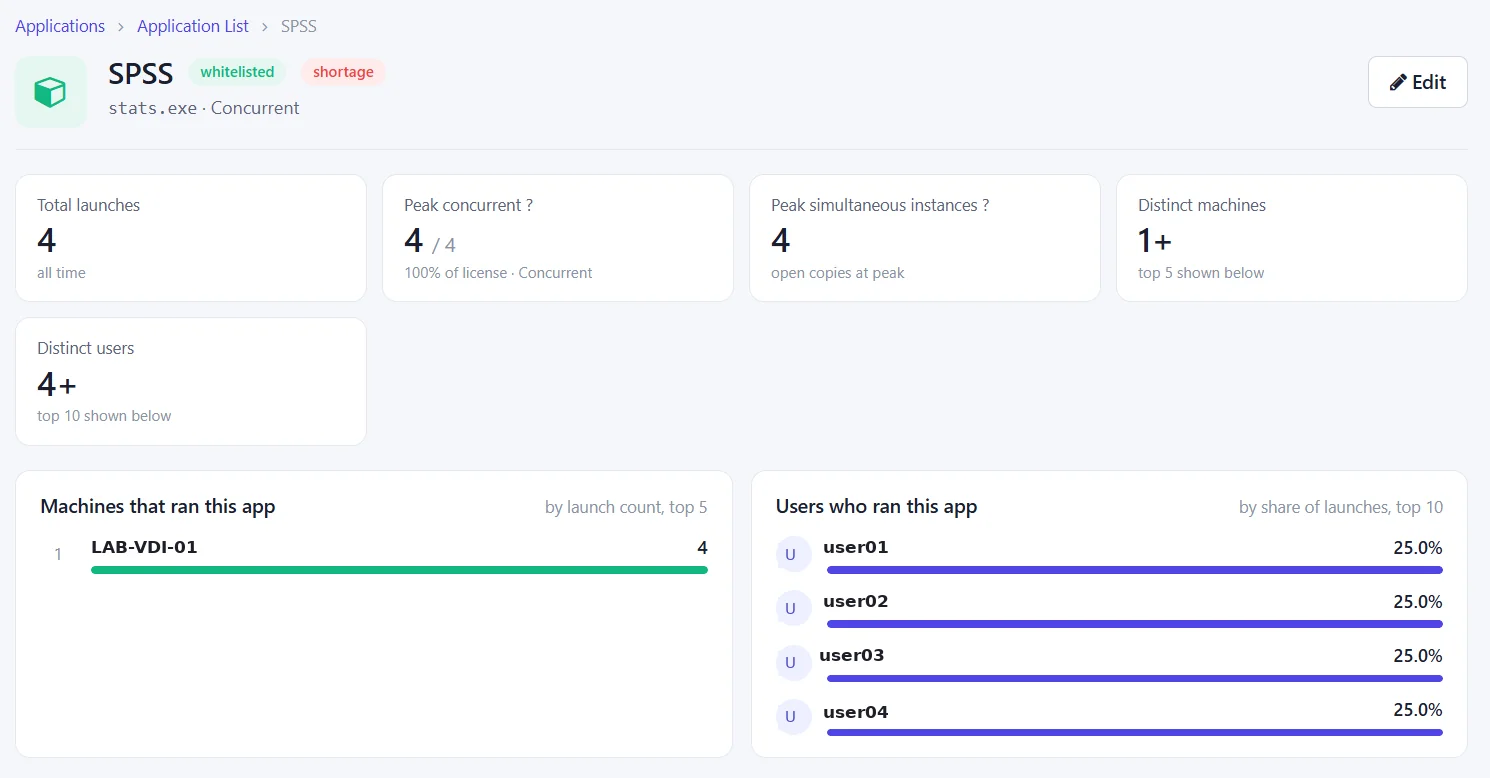
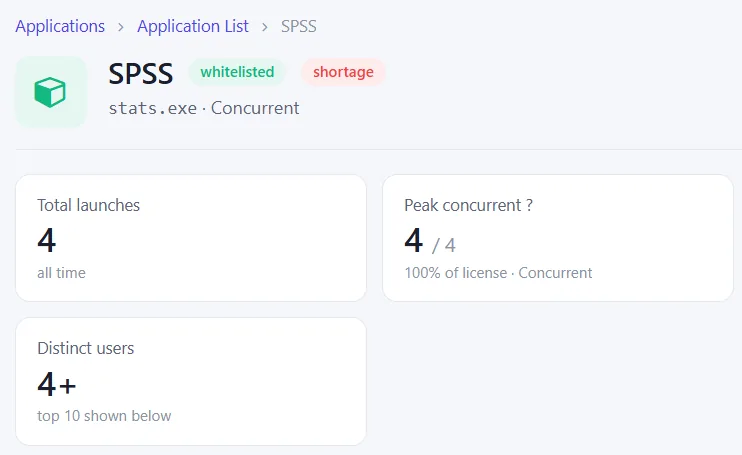
vDash SPSS application view showing peak concurrent use at 4 of 4 licences and a licence shortage flag

Monitor Your Users, Machines and Applications Usage

CloudDesk vDash is a simple and customizable monitoring, metering and reporting tool, to gather and display usage statistics on a dashboard online
72-second tour of vDash (sample data). Start a free 2-week pilot.

CloudDesk vDash Key Benefits

1. Optimise Resources Utilisation

CloudDesk enables you to monitor itemized or grouped IT resources, providing you a clear understanding of its utilization rate and how you can optimise ROI and costs savings

2. Supports Customisation & Multiple Businesses

It allows you to create and customise your own users, machines, applications, licenses and inventory listings and groupings. It also supports management of multiple business entities or units, hence providing both choice of filtered and/or consolidated reporting.

3. Cloud-based and multi-tenanted

It is cloud-based and multi-tenanted, allowing authorised access by intended personnel anytime, anywhere even across geographical spread

How It Works

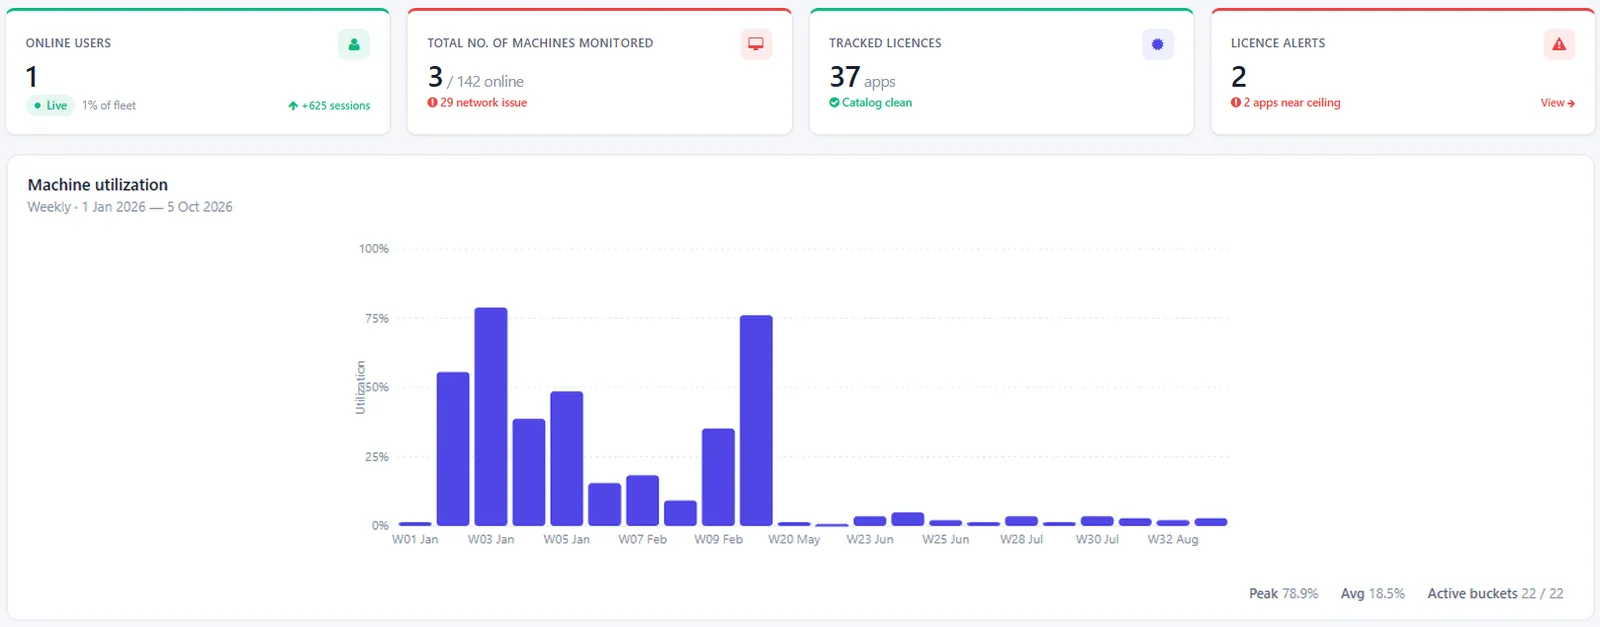
vDash dashboard showing online users, machines monitored, tracked licences and licence alerts above a weekly machine utilisation chart with peak and average use
One dashboard for live users, fleet health, licence alerts and weekly lab utilisation.
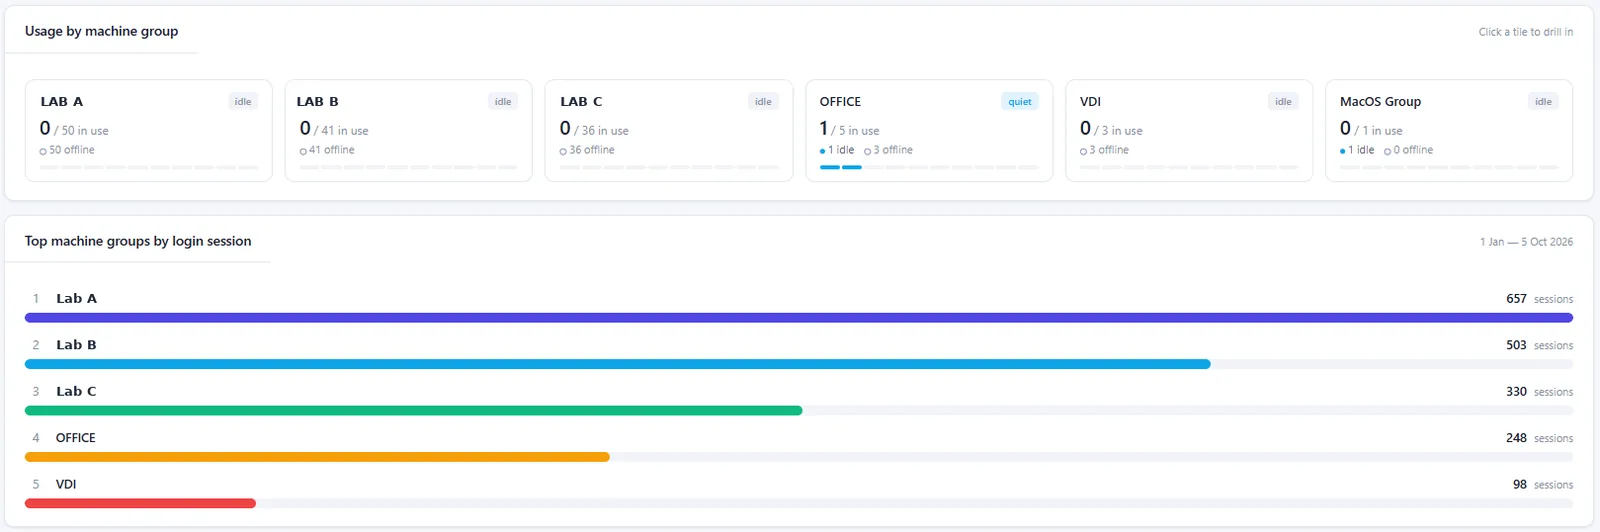
vDash usage by machine group tiles for anonymised labs with in-use and offline counts, and top machine groups ranked by login sessions
See which labs are busy, idle or offline, and rank them by login sessions.

See the insights in vDash

Real vDash screens (names and machine details anonymised). Each one turns lab usage data into a decision you can act on.

vDash application detail for SPSS showing peak concurrent use at 4 of 4 licences, flagged as a licence shortage, with launches by machine and by user

Peak concurrent licence use

See peak concurrent licence use per app, so you buy for real demand, not installs.

Usage by user and department

Know which departments actually use each licensed app, and when.

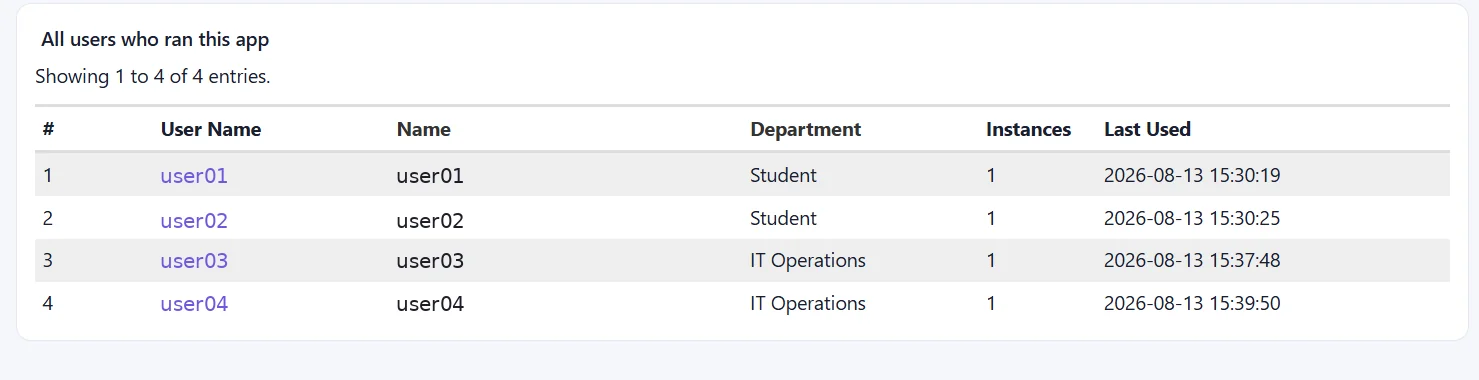
vDash table of anonymised users who ran SPSS, with department, instance count and last-used time
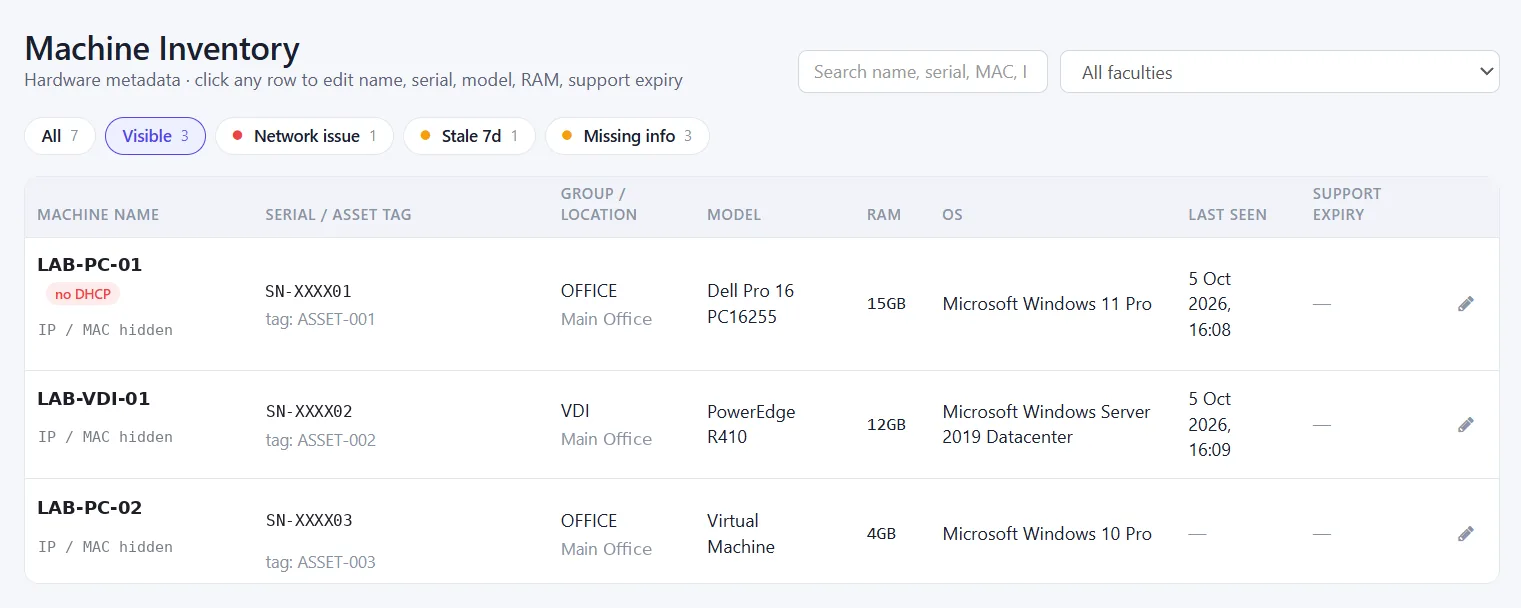
vDash machine inventory listing lab PCs with serial and asset tags, location, model, RAM, operating system and last-seen time, with filters for network issues, stale and missing info

Live machine inventory

Spot stale, offline or incomplete PCs at a glance and keep the asset register accurate.

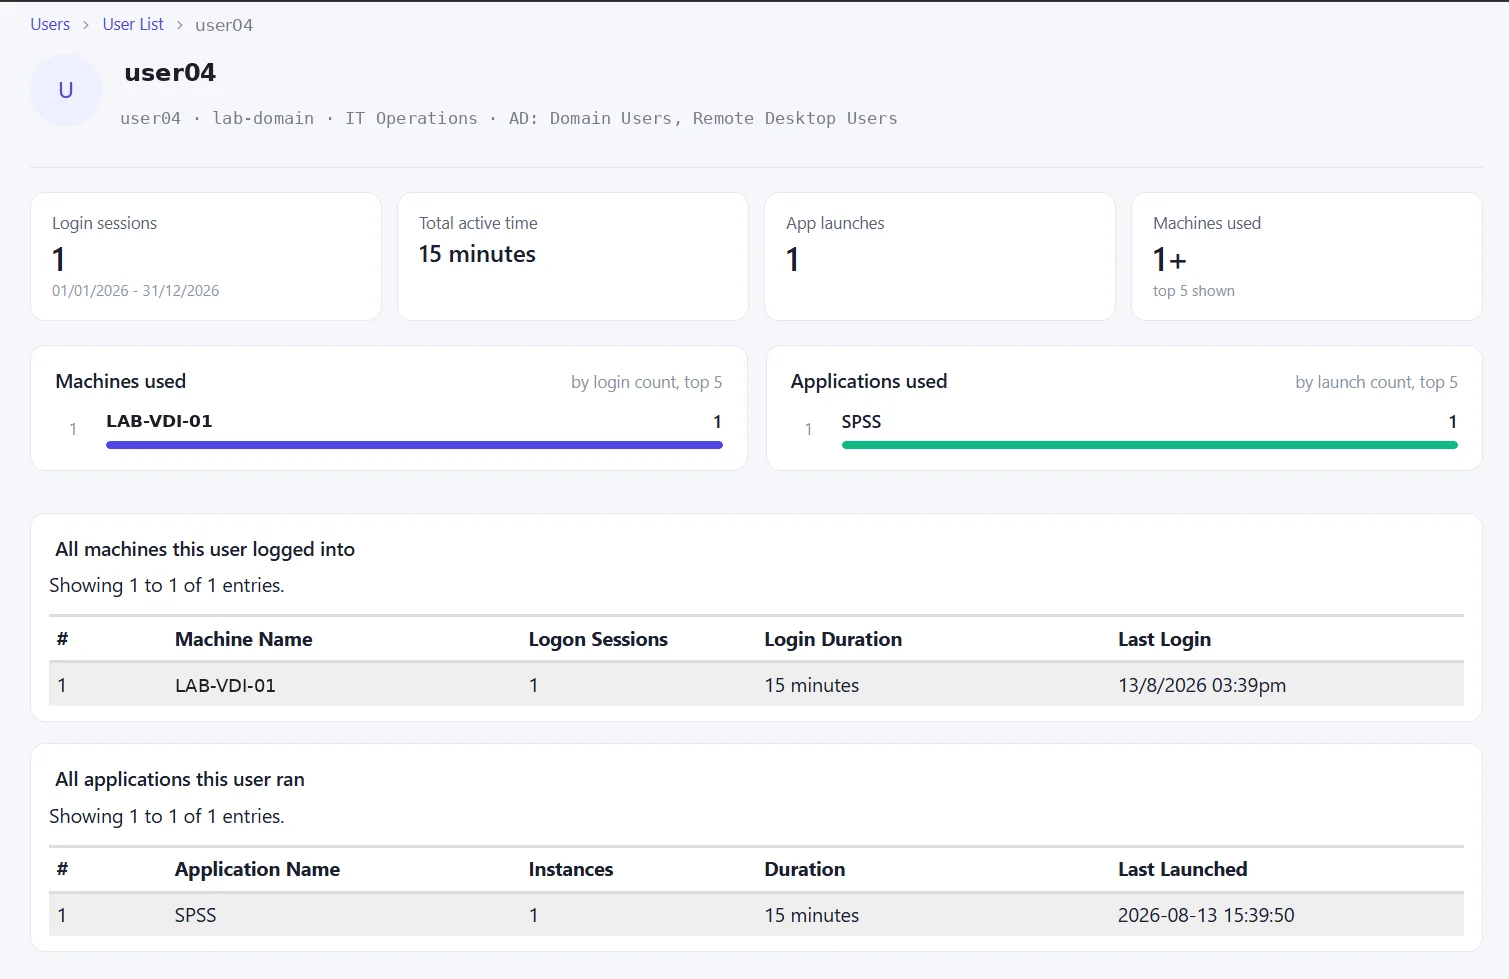
User activity, end to end

Trace how one user uses lab PCs and applications, from logins to app sessions.

vDash user activity view for an anonymised user showing login sessions, active time, machines used and applications run
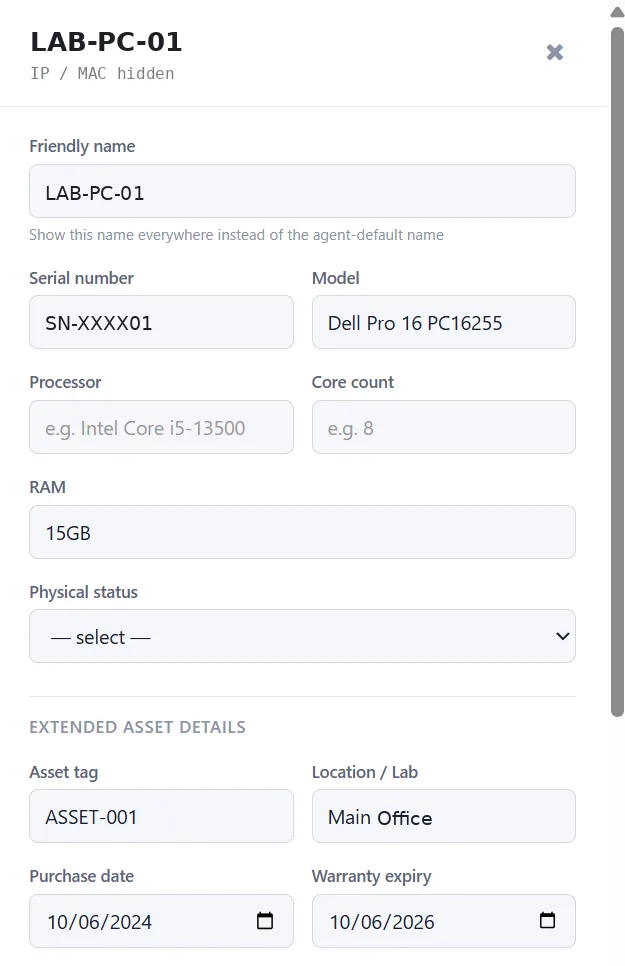
vDash machine asset details form with friendly name, serial number, model, RAM, asset tag, location, purchase date and warranty expiry

Asset and warranty tracking

Track warranty and support expiry per PC so renewals never catch you out.

New in vDash

Six new features for IT and lab admins

Track renewals before they are due, manage inventory from a spreadsheet, and give every faculty and department the reports that matter to them.

Contract and licence expiry tracking

Assign an owner to every software licence or hardware asset, set expiry dates and see the days remaining at a glance. A dashboard widget highlights what is expiring soon, with a full audit trail of who changed what.

Automatic expiry email reminders

vDash emails the assigned contract owner at several checkpoints before expiry, with the asset name, owner and exact expiry date. No manual follow-up needed.

CSV and Excel import and export

Export your full app or machine inventory in one click, or bulk-import assets from existing spreadsheets using a clean template. Covers licence counts, app names, versions and departments.

Click-through navigation

Drill down from machine to user to apps. See who is on a machine and what it runs, a user's machine history and sessions, or every machine running an app, with a breadcrumb trail at each step.

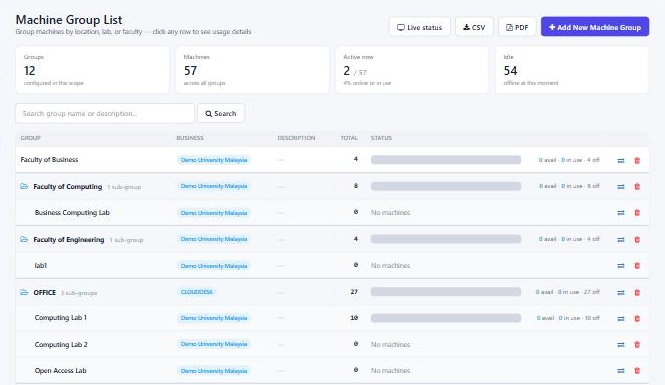
Faculty and department groups

Organise machines and users in a Faculty → Department hierarchy, then filter every report and dashboard by department. Built for multi-campus and multi-faculty deployments.

Role-based departmental reports

Department heads see only their own machine and app usage; IT admins keep the full campus-wide view. Automated PDF and Excel reports are scoped by department, with role permissions managed centrally.
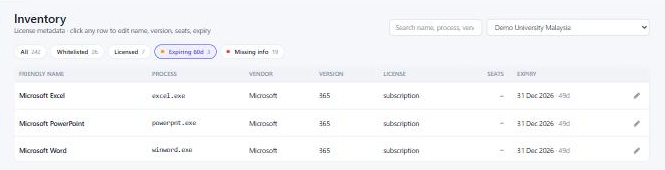
vDash application inventory filtered to licences expiring soon, showing expiry dates per app (demo data)
Licences expiring soon, at a glance (sample data, anonymised)
vDash Machine Group List with machines grouped by faculty and department, such as Faculty of Computing and Computing Lab 1 (demo data)
Machines grouped by faculty and department (sample data, anonymised)

Get Started Today!

Contact us to learn more about our products and services.

Request a free vDash pilot
Name
Name
First Name
Last Name